Forex trading strategies: the ultimate pass-fail test
Most forex trading strategies fail before the first trade is placed. Not because the entry signal is weak, but because the system has no measurable boundary between normal variance and actual failure.
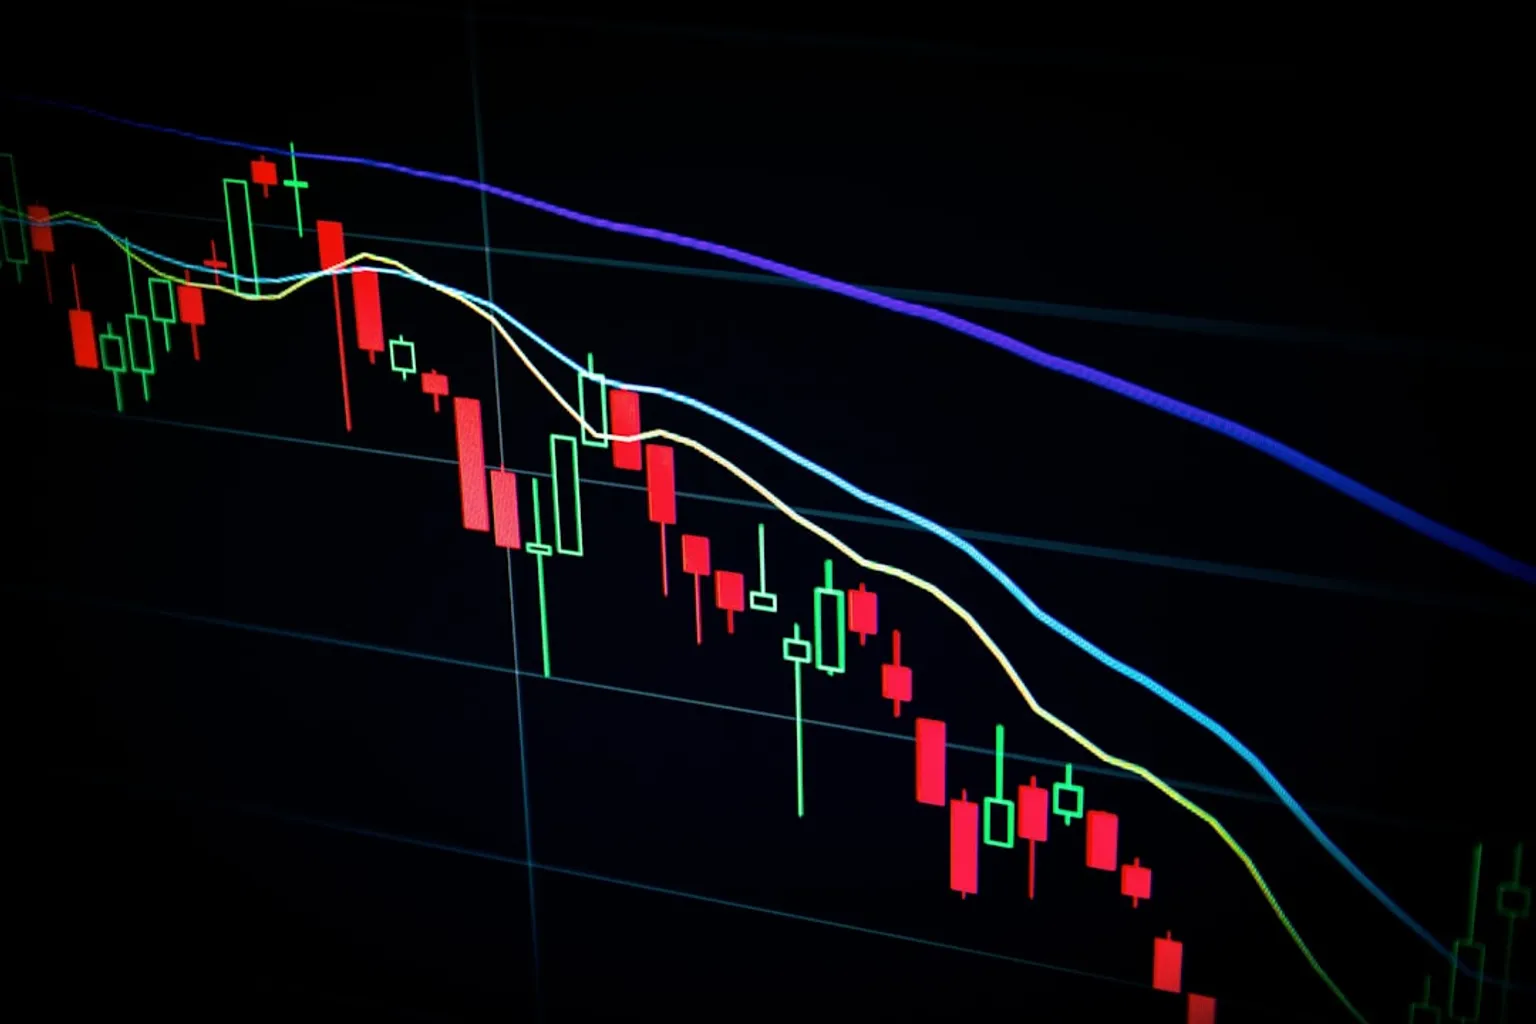
The market is open 24 hours a day, five days a week, across Sydney, Tokyo, London, and New York. That structure creates the illusion of constant opportunity. In practice, it creates four different volatility regimes stitched into one price feed. A strategy that prints clean signals during London may bleed during late New York. A carry trade that looks attractive on the interest-rate differential can be invalidated by one policy statement. The baseline scenario is never “the strategy works.” The baseline is: the strategy works under defined conditions, at defined size, with a defined stop, until the market proves otherwise.
A strategy is not an entry signal
The most common mispricing in retail strategy evaluation is treating the entry rule as the system. “Buy EUR/USD above the 20-day moving average” is not a strategy. It is a trigger. “Short GBP/JPY after a failed breakout” is not a strategy. It is a setup. The actual strategy is the full distribution of outcomes after costs, sizing, volatility filters, session timing, and macro event risk.
A passable FX strategy must answer five questions before it earns capital:
1. What is the market condition it is designed to exploit?
Trend continuation, mean reversion, carry, post-data momentum, liquidity vacuum, option-expiry pinning, or session breakout. If the edge cannot be named, it cannot be monitored.
2. What is the expected reward relative to the defined loss?
A strategy with a 0.6 risk-reward ratio needs a materially higher hit rate than a strategy with a 2.0 ratio. That is arithmetic, not trading style.
3. Where is the invalidation level?
The stop cannot be where the trader becomes uncomfortable. It must be where the original premise no longer holds.
4. What macro condition would suspend the model?
Central-bank decisions, CPI releases, GDP surprises, labor-market data, and policy guidance can all change the volatility state of a currency pair.
5. How much equity is at risk if the next trade is wrong?
Standard risk management typically means risking no more than 1% to 2% of total account equity on a single trade. Above that range, the strategy may still win trades, but the account becomes too sensitive to normal variance.
The entry gets the attention. The loss distribution pays the bill.
This is where many “profitable currency trading systems” degrade. They are optimized for screenshots, not survival. A system that wins 60% of the time but loses three times the average gain on the remaining 40% has negative expectancy. A system that backtests well but requires leverage beyond what the account can tolerate is not undercapitalized. It is structurally unstable.
The mechanics of risk: position sizing is the first audit
Position sizing is the cleanest pass-fail line because it removes opinion. The standard formula is simple:
Position Size = (Account Equity × Risk Percentage) / Stop Loss Distance in Pips
The formula does not care whether the signal feels strong. It does not care whether the last three trades won. It translates a thesis into a controlled loss.
Assume a trader has $25,000 in equity and risks 1% per trade. The maximum planned loss is $250. If the stop distance is 50 pips, the position size must be calibrated so that 50 pips equals $250. If volatility expands and the stop must be 100 pips, the position size must be cut in half. Keeping the same lot size because the trade “looks good” is not conviction. It is leverage drift.
A strategy passes the risk test only if the position size adjusts to volatility. Fixed lots across all pairs and all regimes are usually a hidden bet on stable volatility. FX does not offer that stability. USD/JPY during a Bank of Japan repricing is not EUR/CHF during a quiet European morning. GBP crosses do not behave like AUD/NZD when commodity sentiment changes. The pip is not the risk. The dollar value of the pip, the stop distance, and the probability of a gap through the stop are the risk.
| Test variable | Passing condition | Failing condition |
|---|---|---|
| Risk per trade | 1% to 2% of equity, pre-defined | Size increases after losses or “high-conviction” signals |
| Stop placement | Tied to invalidation of setup | Tied to pain tolerance or arbitrary round numbers |
| Volatility adjustment | Position shrinks as stop distance widens | Same lot size across quiet and stressed regimes |
| Leverage use | Consistent with account drawdown tolerance | Dependent on maximum available leverage |
| Loss sequence | Survives expected losing streak | Requires near-perfect execution to avoid ruin |
Leverage deserves separate treatment. Common regulatory limits in some jurisdictions sit around 1:30 to 1:50 for retail clients. Those limits can still be more than enough to destroy a poorly sized strategy. The relevant metric is not available leverage. It is effective leverage at the stop. A trader using 10:1 exposure with a narrow stop and a liquid pair may have less account risk than a trader using 3:1 exposure with no defined exit into a central-bank event.
A professional audit starts with the losing sequence, not the winning month. If the strategy cannot tolerate five consecutive losses at normal size, it is too aggressive. If ten losses would put the trader into behavioral distress, the size is still too high. The market does not need to deliver an extreme event to break an oversized system. A routine one-standard-deviation drawdown can be sufficient.
Technical setup plus fundamental regime, not one versus the other
The weak version of technical analysis ignores macro. The weak version of fundamental analysis ignores execution. Forex trading strategies need both, because currencies are relative macro assets traded through technical liquidity points.
Fundamental analysis in FX focuses on macroeconomic factors such as GDP growth, inflation rates, and central-bank interest-rate decisions. Those variables define the policy path and, by extension, yield expectations. Technical levels define where risk can be expressed. Treating them as separate camps is inefficient.
A cleaner structure is conditional:
- If inflation is persistent and the central bank is still restrictive, trend-following setups in that currency may deserve a higher baseline probability.
- If growth data weakens while inflation also cools, the market may start pricing rate cuts; rallies in that currency can become vulnerable to rejection.
- If the central bank’s statement conflicts with market positioning, the first move after the announcement may be less reliable than the second session’s reaction.
- If a pair is approaching a known technical level into CPI or a rate decision, the level is not support or resistance in isolation. It is a liquidity zone exposed to event risk.
This is not a call to overload the model. Too many variables create a strategy that explains everything after the fact and trades nothing in real time. The pass-fail test is whether the fundamental filter changes position size, trade permission, or invalidation. If it only appears in the commentary, it is not part of the strategy.
A practical example: suppose USD is supported by stronger inflation data and a central bank that remains unwilling to signal easing. A EUR/USD short setup at a failed resistance level has macro alignment. The same technical short, if US yields are falling and European data is improving, has weaker alignment. It may still work, but the expected value is lower. That difference should show up in either smaller size, a more conservative target, or no trade.
The hierarchy matters:
1. Macro regime defines the preferred direction or the no-trade condition.
2. Technical structure defines the entry, stop, and target.
3. Volatility defines position size.
4. Event calendar defines whether the trade is allowed to stay open.
The pass-fail threshold is not whether the trader can explain the chart. It is whether the strategy behaves differently when the macro backdrop changes.
Session volatility is not background noise
The 24/5 structure of the FX market is often presented as a convenience. For strategy evaluation, it is a complication. Sydney, Tokyo, London, and New York are not interchangeable liquidity windows. The same setup can have different expectancy depending on which session triggers it.
A breakout strategy may need London participation. A mean-reversion model may perform better when liquidity is thinner but directional sponsorship is limited. A news-driven USD strategy may require New York confirmation. An Asia-range setup on USD/JPY is not the same product as a London impulse in EUR/USD.
A serious fx strategy evaluation should tag every trade by session. Without that tag, the trader may average away the actual edge. A strategy can look flat overall while being profitable in one window and negative in another. That is not a mediocre system. It is an unsegmented system.
| Session | Typical strategic issue | What the audit should isolate |
|---|---|---|
| Sydney | Thin liquidity, wider sensitivity to headlines | Whether signals are genuine or spread-driven |
| Tokyo | JPY, AUD, NZD flows; regional risk tone | Whether range logic or Asia breakout logic dominates |
| London | Liquidity expansion, European data, trend initiation | Whether breakouts have follow-through after the first impulse |
| New York | US data, Fed repricing, London overlap | Whether moves extend or reverse after US participation |
The London-New York overlap is usually the most relevant window for liquid USD pairs, but “most relevant” is not the same as “always best.” If a system is built around clean technical levels, that overlap can also create stop runs and false continuation signals. A stop placed just beyond a session high may be technically logical and still vulnerable to liquidity sweeps. That does not invalidate technical analysis. It invalidates lazy stop placement.
A strategy without session data is a blended average of four different markets.
Session analysis should affect at least three parts of the model: trade permission, target distance, and stop logic. A 30-pip target that is reasonable during Asia may be too small during a US CPI release. A 100-pip stop that looks prudent during New York may be excessive during a quiet Tokyo range. The position-sizing formula absorbs some of that difference, but not all of it. The better filter is not to trade a strategy outside the conditions where it was designed to operate.
Carry trades: yield is compensation, not protection
The carry trade is one of the oldest FX strategies because the mechanism is intuitive: borrow in a low-interest-rate currency and invest in a higher-interest-rate currency, capturing the interest-rate differential. The problem is that the yield is visible while the tail risk is often deferred.
Carry works best when volatility is contained, funding currencies remain stable, and the higher-yielding currency is supported by credible policy and acceptable external balances. It performs poorly when risk sentiment breaks, central banks pivot, or markets start questioning the sustainability of the yield advantage.
The pass-fail test for a carry strategy is not whether the interest differential is attractive. It is whether the differential compensates for drawdown risk. A high-yielding currency can lose months of carry in a few sessions if the market moves into liquidation mode. The carry is incremental. The spot loss can be abrupt.
A carry model should be treated as a position with three risk layers:
- Rate differential risk. The expected carry changes if either central bank shifts its policy path.
- Spot FX risk. The exchange rate can move against the position faster than carry accrues.
- Risk-sentiment risk. Higher-yielding currencies often behave poorly when global risk appetite deteriorates.
This is why carry strategies need explicit macro invalidation. If the central bank supporting the long leg signals a dovish shift, the trade is not merely less attractive. Its premise may be broken. If the funding currency begins to strengthen on safe-haven demand, the position can lose both directionally and psychologically. Traders often hold carry losers because the daily credit feels like compensation. That is usually a poor risk-reward ratio.
A disciplined carry strategy can still have a place in a portfolio, but it should not be sized like a short-term technical trade unless the stop logic is equally short-term. Carry is often slower to earn and faster to lose. That asymmetry must be priced into the position.
Stress-testing against central-bank repricing
The most dangerous strategies are not the ones that lose immediately. They are the ones that work in one monetary regime and silently decay when the regime changes. Central banks are the main source of that decay. Interest-rate decisions, inflation language, balance-sheet guidance, and forward guidance can all alter the distribution of returns.
A strategy that bought dips in a high-yielding currency during a tightening cycle may underperform when the market starts pricing cuts. A dollar breakout model may fail if US data cools and Treasury yields fall. A yen short strategy may become unstable if the Bank of Japan shifts its tolerance for currency weakness or changes policy guidance.
Stress-testing does not require pretending to forecast every central-bank decision. It requires asking how the strategy behaves under defined shocks:
1. Policy surprise shock.
What happens if the central bank delivers a rate decision or statement that conflicts with consensus positioning?
2. Inflation repricing shock.
What happens if CPI changes the expected policy path and the currency gaps through the technical level?
3. Growth deterioration shock.
What happens if GDP or labor data weakens enough to change the market’s rate-cut expectations?
4. Volatility expansion shock.
What happens if average stop distance doubles for two weeks?
5. Correlation shock.
What happens if multiple positions that appeared diversified all become the same USD or risk-sentiment trade?
The fifth point is usually underweighted. A trader may believe he has three independent positions: long USD/JPY, short EUR/USD, and short AUD/USD. In a USD shock, that is one position expressed three ways. Correlation risk converts a diversified-looking book into a concentrated macro bet. The pass-fail test is whether aggregate exposure remains acceptable if the common factor moves one standard deviation against the book.
This is where a strategy audit moves from trade level to portfolio level. Risking 1% on each trade is not conservative if five trades all depend on the same central-bank outcome. The account is not risking 1%. It is risking a cluster. The proper response is to reduce position size, choose the cleanest expression, or stagger entries across confirmation points.
The pass-fail matrix
A useful strategy audit should not produce a vague grade. It should produce one of three decisions: trade, trade smaller, or suspend. The matrix below is a practical framework. It is not a guarantee of profit. It is a way to prevent weak conditions from receiving full-size risk.
| Condition | Trade | Trade smaller | Suspend |
|---|---|---|---|
| Macro alignment | Central-bank path and data support direction | Mixed data or policy ambiguity | Major event risk contradicts premise |
| Technical structure | Clear entry, stop, and target | Entry valid but target compressed | Stop cannot be placed logically |
| Volatility | Stop distance normal for pair/session | Volatility elevated but measurable | Volatility unstable or spread distorted |
| Session quality | Signal appears in intended liquidity window | Signal appears near transition period | Signal appears in unsuitable session |
| Correlation | Exposure independent or controlled | Partial overlap with existing book | Same macro bet already at risk |
| Position sizing | Loss capped at 1% to 2% of equity | Size reduced below standard risk | Required stop makes size impractical |
The decision tree is deliberately conservative. The market does not pay extra for taking full-size trades in poor conditions. A reduced position is often the correct risk-adjusted response to uncertainty. No position is also a position, particularly before major central-bank decisions.
There is a tendency to treat “suspend” as failure. It is usually evidence that the strategy has rules. A model that always finds a reason to trade is not adaptive. It is promotional.
Performance metrics that actually matter
Win rate is not useless, but it is incomplete. A 45% win-rate strategy can be profitable with strong average winners. A 70% win-rate strategy can be fragile if losses are large and clustered. The audit should focus on expectancy, drawdown, volatility of returns, and behavior under stress.
The minimum performance record should include:
- Average win versus average loss.
This defines whether the strategy needs a high hit rate or can survive frequent small losses.
- Maximum drawdown and drawdown duration.
The depth matters, but the time spent recovering matters as much. A strategy that takes six months to recover from routine variance may be too capital-intensive.
- Standard deviation of trade returns.
High dispersion means the trader should reduce size or accept wider confidence bands around results.
- Loss clustering.
A strategy that loses mainly during specific macro regimes should include a filter. A strategy that loses randomly may need a broader sizing adjustment.
- Slippage and spread sensitivity.
Short-horizon systems can look profitable before costs and fail after execution.
- Event exposure.
Trades held through CPI, GDP, employment data, or central-bank decisions should be tagged separately from ordinary technical trades.
The invalidation level for a strategy should be defined before live deployment. One practical method is to set a performance boundary relative to the backtest or forward-test distribution. For example, if live drawdown exceeds 1.5 times the tested maximum drawdown under comparable market conditions, the model moves to review. If slippage rises enough to erase the expected edge, the model is suspended. If the strategy’s average loss expands beyond the planned risk because stops are repeatedly filled poorly, the issue is execution, not psychology.
These are not universal constants. They are governance rules. The key is that they exist before the losing period begins. During a drawdown, traders are poor statisticians. They either abandon valid systems too early or defend broken systems too long. Predefined invalidation levels reduce both errors.
Final risk parameters
The strongest forex trading strategies are not the ones with the most elegant entries. They are the ones that define the market condition, size the position correctly, integrate macro risk, segment session behavior, and stop trading when the premise is invalidated.
My baseline test is strict:
- Risk per trade should remain within the 1% to 2% equity range, with lower risk when volatility or correlation rises.
- Position size must be calculated from account equity, risk percentage, and stop distance. Fixed-lot sizing fails the audit unless volatility is explicitly controlled elsewhere.
- Any strategy trading through CPI, GDP, employment data, or central-bank decisions needs a separate event-risk rule.
- Session performance must be measured. A model that works in London should not be assumed to work in Tokyo.
- Carry trades must include spot-loss limits and central-bank invalidation, not just yield logic.
- Portfolio exposure must be assessed by common macro factor, especially USD, JPY, and global risk sentiment.
- A live strategy should move to review if drawdown exceeds a predefined boundary, such as 1.5 times the tested maximum under comparable conditions.
- A setup is invalid if price reaches the level where the original premise no longer holds; the stop is not a negotiation point.
The final pass-fail standard is simple. If the strategy can describe its edge, cap its loss, adjust to volatility, respect the macro calendar, and survive a normal losing sequence without discretionary rescue, it is tradeable. If it needs confidence, leverage, or favorable conditions to hide weak risk controls, it fails. In FX, that distinction is the difference between a strategy and a directional opinion with a lot size attached.